Temperatures to InfluxDB with Grafana Visualisation on Raspberry Pi
Note
This recipe is outdated. There is a new 2.x version of InfluxDB which integrates a web interface
and dashboard (Grafana is not necessary). See the documentation for the v2
InfluxDB2DataSink plugin for more information.
This recipe is for running on a Raspberry Pi. It will collect temperature readings from commonly available DS18B20 temperature sensors and log them in an InfluxDB database. Grafana is used display the data over a web interface.
Hardware Setup
Any Raspberry Pi should work, this was tested using a Raspberry Pi 3 running Raspbian Buster using a Linux 4.19 kernel.
The DS18B20 temperature sensors require a 4.7 kΩ pullup resistor connected between the VCC and DATA lines. Some integrated modules already include the resistor. Connect the VCC to the RPi GPIO 3.3 V (pin 1), GND to ground (pin 6), and DATA to pin 7.
The 1-Wire bus on the RPi is not enabled by default. The easiest way to enable
it is to run sudo raspi-config and select 1-Wire from the Interfacing
Options. A reboot will be required. After the restart, check the sensor is
detected with ls /sys/bus/w1/devices, which should list one or more devices
starting with 28- and then a hex serial number. A reading can be obtained by
running cat /sys/bus/w1/devices/28-xxxxxxxxxxxx/w1_slave, where
xxxxxxxxxxxx is the serial number of the sensor. The response should include
something like t=22062, where 22062 indicates 22.062 ℃.
The standard Linux libsensors is able to read the temperatures from attached probes:
sudo apt install libsensors5 lm-sensors
pip3 install --user PySensors
and can be read by running sensors.
Software Setup
InfluxDB
Add InfluxDB repository to apt sources (change buster to match your raspbian version):
wget -qO- https://repos.influxdata.com/influxdb.key | sudo apt-key add -
echo "deb https://repos.influxdata.com/debian buster stable" | sudo tee /etc/apt/sources.list.d/influxdb.list
Install InfluxDB, python plugin module, and start the systemd service:
sudo apt-get update
sudo apt-get install influxdb
pip3 install --user influxdb
sudo systemctl enable --now influxdb.service
The default configuration is probably OK, but can be changed by editing
/etc/influxdb/influxdb.conf. The database service will be operating on port
8086.
Create a database for datalogd to store its data:
influx
create database datalogd
exit
Grafana
Follow instructions on the Grafana website to get latest version for your Raspberry Pi (eg. ARMv7). As of writing, for the Raspberry Pi 3 this is:
The Grafana server should be serving web pages from port 3000, so log into your
RPi with a web browser and check that it is working (eg. visit
http://ip_of_your_pi:3000).
Recipe
The connection graph can be configured using most defaults as:
recipes/rpi_temperature_influxdb.config¶[datalogd]
connection_graph =
digraph {
a [class=LibSensorsDataSource];
f [class=KeyValDataFilter, key="type", val="temperature"];
s [class=InfluxDBDataSink];
a -> f -> s;
}
If you have changed the database configuration, such as usernames or passwords,
then these must be set in the attruibutes for the
InfluxDBDataSink node.
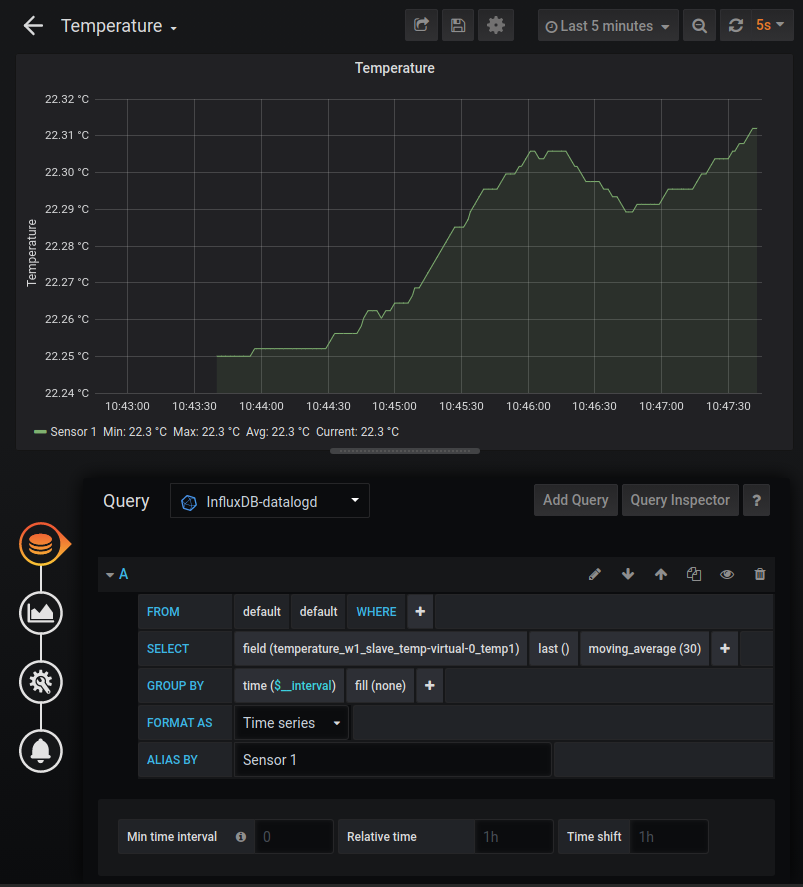
Visualisation
Log into your Grafana server (eg. http://ip_of_your_pi:3000. Configure an
InfluxDB data source, using all default parameters. Configure a Grafana
Dashboard as pictured: