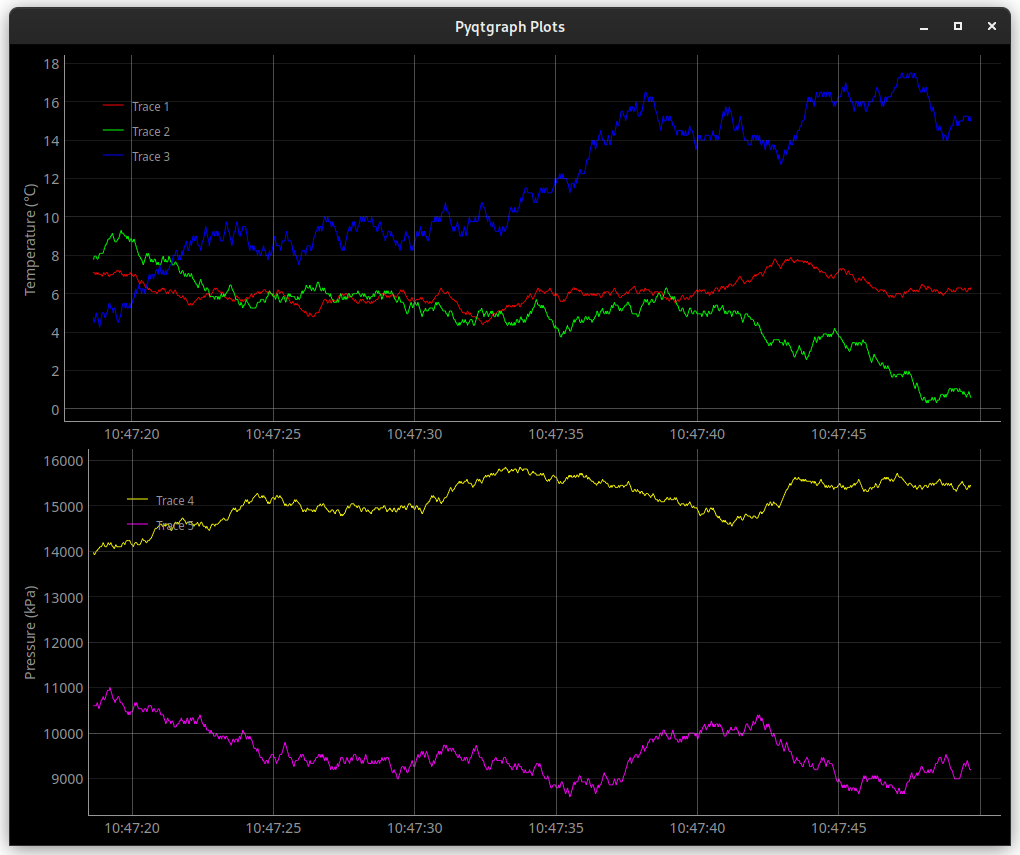
Realtime Plots with Pyqtgraph
This generates five sets of random data using the RandomWalkDataSource
and plots them in realtime as traces on a pyqtgraph plot using PyqtgraphDataSink.
The plotlayout parameter demonstrates setting up two stacked plot panels and styling the five traces.
recipes/randomwalk_pyqtgraph.config¶[datalogd]
connection_graph =
digraph {
a [class=RandomWalkDataSource, interval=0.03, walkers="[[5.6, 0.10], [7.8, 0.15], [9.0, 0.25], [12345, 45], [12345, 67]]"];
s [class=PyqtgraphDataSink, npoints=1024, title="Pyqtgraph Plots", size="[1000, 800]", plotlayout="
[
{
'ylabel': 'Temperature (℃)',
'traces': [
{
'name': 'Trace 1',
'pen': [255, 0, 0],
'selector': [
['type', 'randomwalk'],
['id', '0']
]
},
{
'name': 'Trace 2',
'pen': [0, 255, 0],
'selector': [
['type', 'randomwalk'],
['id', '1']
]
},
{
'name': 'Trace 3',
'pen': [0, 0, 255],
'selector': [
['type', 'randomwalk'],
['id', '2']
]
}
]
},
{
'ylabel': 'Pressure (kPa)',
'traces': [
{
'name': 'Trace 4',
'pen': [255, 255, 0],
'selector': [
['type', 'randomwalk'],
['id', '3']
]
},
{
'name': 'Trace 5',
'pen': [255, 0, 255],
'selector': [
['type', 'randomwalk'],
['id', '4']
]
}
]
}
]
"];
a -> s;
}
$ datalogd -c recipes/randomwalk_pyqtgraph.config
INFO:main:Initialising DataLogDaemon.
INFO:DataLogDaemon:Loaded config from: recipes/randomwalk_pyqtgraph.config
INFO:pluginlib:Loading plugins from standard library
INFO:DataLogDaemon:Detected source plugins: NullDataSource, PicoTC08DataSource, RandomWalkDataSource, SerialDataSource
INFO:DataLogDaemon:Detected filter plugins: NullDataFilter, AggregatorDataFilter, CoolingPowerDataFilter, CSVDataFilter, FlowSensorCalibrationDataFilter, JoinDataFilter, KeyValDataFilter, PolynomialFunctionDataFilter, TimeStampDataFilter
INFO:DataLogDaemon:Detected sink plugins: NullDataSink, FileDataSink, InfluxDB2DataSink, LoggingDataSink, MatplotlibDataSink, PrintDataSink, PyqtgraphDataSink
INFO:DataLogDaemon:Initialising node a:RandomWalkDataSource(interval=0.03, walkers=[[5.6, 0.1], [7.8, 0.15], [9.0, 0.25], [12345, 45], [12345, 67]])
INFO:DataLogDaemon:Initialising node s:PyqtgraphDataSink(npoints=1024, title=Pyqtgraph Plots, size=[1000, 800], plotlayout=[{'ylabel': 'Temperature (℃)', 'traces': [{'name': 'Trace 1', 'pen': [255, 0, 0], 'selector': [['type', 'randomwalk'], ['id', '0']]}, {'name': 'Trace 2', 'pen': [0, 255, 0], 'selector': [['type', 'randomwalk'], ['id', '1']]}, {'name': 'Trace 3', 'pen': [0, 0, 255], 'selector': [['type', 'randomwalk'], ['id', '2']]}]}, {'ylabel': 'Pressure (kPa)', 'traces': [{'name': 'Trace 4', 'pen': [255, 255, 0], 'selector': [['type', 'randomwalk'], ['id', '3']]}, {'name': 'Trace 5', 'pen': [255, 0, 255], 'selector': [['type', 'randomwalk'], ['id', '4']]}]}])
INFO:DataLogDaemon:Connecting a:RandomWalkDataSource -> s:PyqtgraphDataSink
INFO:main:Starting event loop.